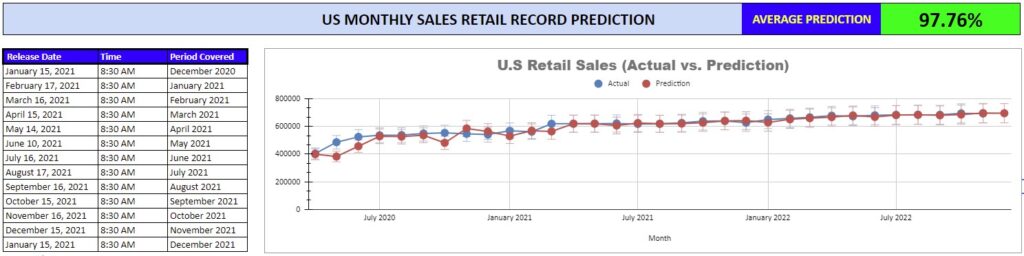
Monthly Prediction of the US retail and Food Services sales Published Monthly By the US Census Bureau with an Accuracy of ~97.76% Average
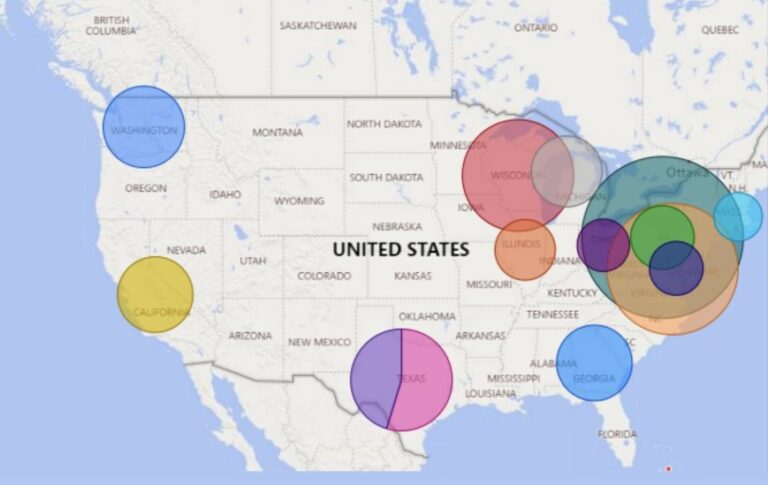
The Business & Economy topic is your portal to comprehensive information about the number, activity, characteristics, and locations of American businesses.
The Census Bureau has been collecting information about American businesses for over 200 years. Today, statistics on almost 27 million business locations are among the Nation’s most important. Business statistics are used to help start a business, compare industries and locations, assess the economic health of local communities, or just to make informed decisions.
What is a Predictive Analysis?
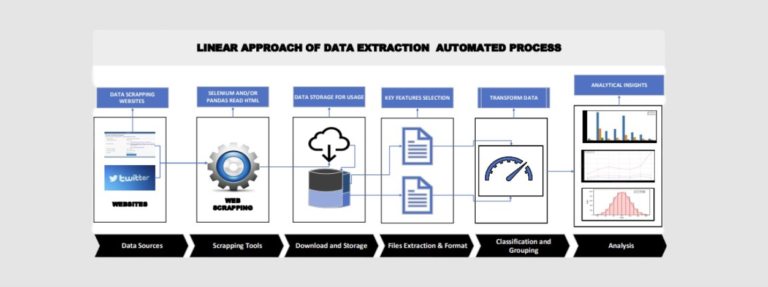
Predictive analysis is the process of making predictions based on past and present data and analyzing hidden trends or patterns in the data. In other words, it’s a method of discovering future events or predicting future sales before it happens. This is not a new concept, but with the help and popularity of Python, a high-level interpreted general-purpose language, and its rich host of numerous libraries, such as Sklearn, Pandas, Matplotlib, Numpy and others, anyone fascinated with Machine Learning and Artificial Intelligence (AI) can develop a predictive model.
A practical example is a meteorologist who predicts weather by forecasting expected weather outcomes based on past and present data by analyzing trends using a predictive model. However, this might not be 100% accurate, but with a high accuracy rate. Let’s look into some practical areas where I have tested some predicted models developed using Python, Sklearn, Mathplotlib, Pandas, Numpy, Seaborn, and other libraries.
I’m very fascinated with technology and have spent a great amount of time studying and practicing the machine learning concept. However, it’s equally important to put some of that self-taught knowledge into a real-life problem to determine how well this model can perform in production. There are various types of machine learning models, depending on the problem one would like to solve – this will determine the type of machine learning model to solve that specific problem.
Predictive models can be used in the health sector to predict the likelihood of someone having a heart attack, by selecting appropriate features to achieve a high performance. Irrelevant or partially relevant features can negatively impact model performance. For binary outcome (Yes/No output), a Logistic Regression model will be appropriate using given factors to determine if a patient will likely have a heart attack or not.
In the banking sector, predictive models can be used to predict someone that would most likely default on credit card payment. Predictive models are used in the bank sector to protect banks from issuing a credit card to someone that their model deemed most likely to default on repayment. The business sector uses predictive models to determine future sales and other future events, such as the number of returning customers or revenue forecast. In the process of developing a prediction model, there are critical steps necessary to get optimal performance. Machine Learning algorithms and Artificial intelligence lifeline is data, the more accurate and refined data available the more optimal performance one can get from machine learning algorithms. However, in real life, perfect data is impossible, as most data scientists and machine learning engineers spend most of their time in data wrangling or data cleaning before that data can be useful and ready for the training and testing process of the model. Overfitting and underfitting are also very important to avoid bias in trained model.
How does Machine Learning Model Works?
To develop a machine learning model, there must be data from the previous activities or transactions data. Those data will be used to training/test and fit the model to predict future results, if the model is given new data that it has not seen before. When new data is present to the model to predict on those new data, the trained model will perform prediction based on the previously train, test, and fit method.
A Practical Example of How Machine Learning Algorithms Were Tested Against Future Data
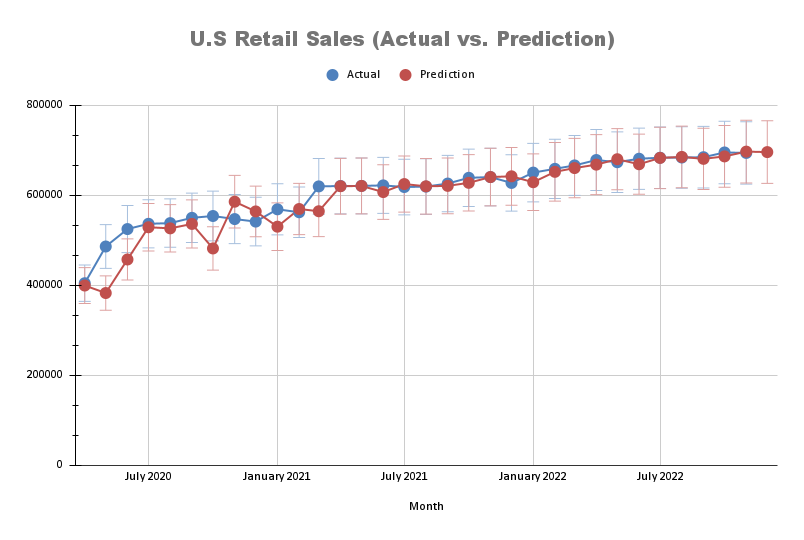
I developed a machine learning model in April 2020 to predict the monthly U.S retail sales published monthly by the U.S Census Bureau. The overall performance of this model has been an average of 95.4% accuracy, which is pretty good in predicting the real-life U.S monthly sales. I compared the actual figures from the US monthly retail sales to my trained model and the results were very impressive. I have been testing this model every month and overall performance seems astonishing, see the graph in the next page.
- Report posted monthly by the U.S Census Bureau between 15 & 17 each month
- Retail sales report a strong indicator of economy health determine if contracting or expanding
- Retail sales in terms of direct economic activity account for almost one-third of GDP
- Used by the Labor and Statistics Bureau to calculate Consumer Price Indices and productivity measurements
| Month | Actual | Prediction | Diff (Pred – Act) | Percentage Accuracy |
| April 2020 | 403,946 | 398,821 | -5,125 | 98.73% |
| May 2020 | 485,545 | 382,152 | -103,393 | 78.71% |
| June 2020 | 524,306 | 456,695 | -67,611 | 87.10% |
| July 2020 | 535,982 | 528,345 | -7,637 | 98.58% |
| August 2020 | 537,526 | 525,885 | -11,641 | 97.83% |
| September 2020 | 549,256 | 535,695 | -13,561 | 97.53% |
| October 2020 | 553,329 | 481,220 | -72,109 | 86.97% |
| November 2020 | 546,504 | 585,088 | 38,584 | 107.06% |
| December 2020 | 540,916 | 563,475 | 22,559 | 104.17% |
| January 2021 | 568,215 | 529,616 | -38,599 | 93.21% |
| February 2021 | 561,685 | 568,891 | 7,206 | 101.28% |
| March 2021 | 619,105 | 563,898 | -55,207 | 91.08% |
| April 2021 | 619,923 | 619,556 | -367 | 99.94% |
| May 2021 | 620,214 | 620,088 | -126 | 99.98% |
| June 2021 | 621,340 | 606,525 | -14,815 | 97.62% |
| July 2021 | 617,719 | 624,297 | 6,578 | 101.06% |
| August 2021 | 618,676 | 619,310 | 634 | 100.10% |
| September 2021 | 625,416 | 620,271 | -5,145 | 99.18% |
| October 2021 | 638,189 | 627,038 | -11,151 | 98.25% |
| November 2021 | 639,829 | 639,863 | 34 | 100.01% |
| December 2021 | 626,833 | 641,510 | 14,677 | 102.34% |
| January 2022 | 649,776 | 628,418 | -21,358 | 96.71% |
| February 2022 | 658,128 | 651,455 | -6,673 | 98.99% |
| March 2022 | 665,726 | 659,841 | -5,885 | 99.12% |
| April 2022 | 677,711 | 667,470 | -10,241 | 98.49% |
| May 2022 | 672,874 | 679,504 | 6,630 | 100.99% |
| June 2022 | 680,591 | 668,366 | -12,225 | 98.20% |
| July 2022 | 682,815 | 682,395 | -420 | 99.94% |
| August 2022 | 683,291 | 684,628 | 1,337 | 100.20% |
| September 2022 | 683,974 | 680,317 | -3,657 | 99.47% |
| October 2022 | 694,518 | 685,792 | -8,726 | 98.74% |
| November 2022 | 693,482 | 696,379 | 2,897 | 100.42% |
| December 2022 | 677,136 | 695,339 | 18,203 | 102.69% |
| January 2023 |